TradingView-Style Drawing Tools for MetaTrader
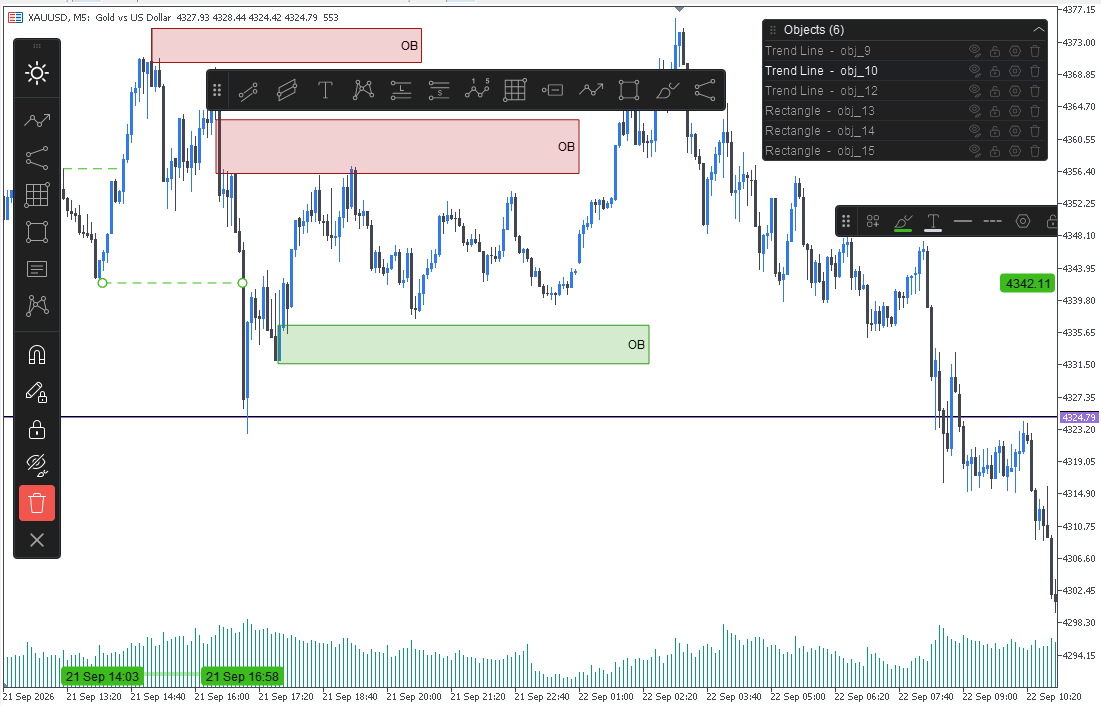
RhinoDraw brings TradingView-style drawing tools to MetaTrader 5 and MetaTrader 4. You get the toolbar, the magnet, the quick styling bar and the smooth, clean lines you are used to, inside your MetaTrader chart. This post explains the main features and how to use them. A second post covers every drawing object, one by one.
Get RhinoDraw for MetaTrader 5
Get RhinoDraw for MetaTrader 4
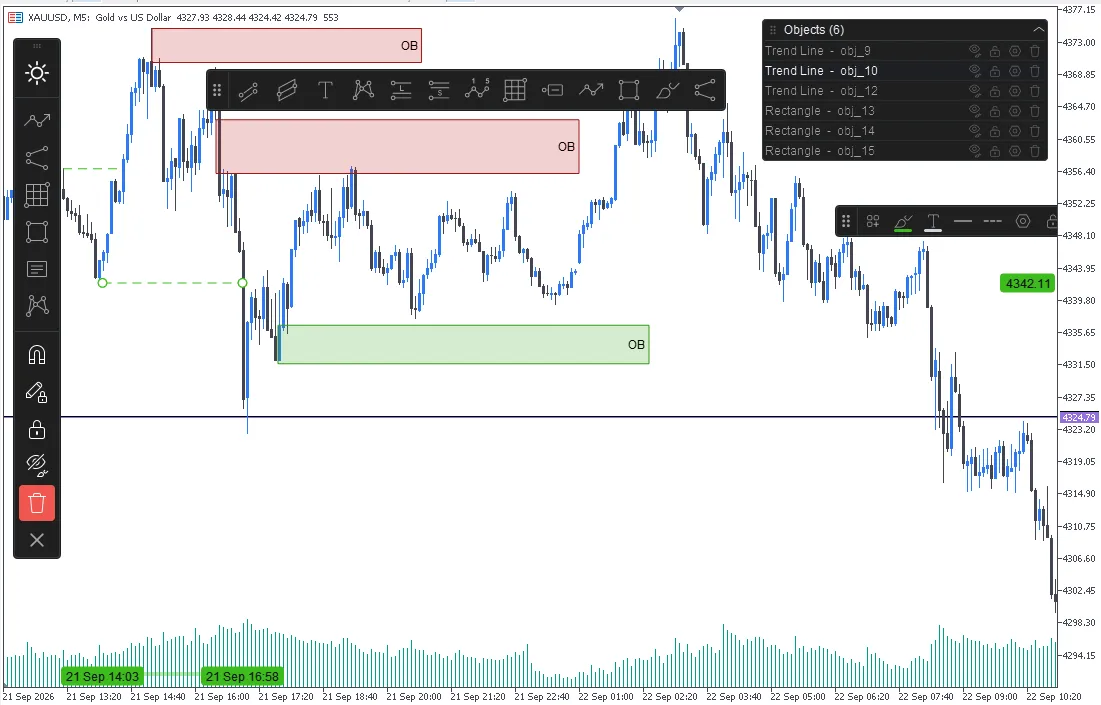
Figure 1. RhinoDraw on a MetaTrader 5 chart: toolbar, favourites, drawings and the Object List.
Why drawing in MetaTrader needed a new tool
MetaTrader has a handful of basic objects. They are hard to select, hard to style, and the menus are several clicks deep. Traders who also use TradingView feel the difference every day. RhinoDraw closes that gap. It gives you:
- More than 50 drawing tools in nine groups: lines, channels, Fibonacci, Gann, shapes, annotations, patterns, projections and brushes.
- A real toolbar that remembers your last tool in each group, plus a favourites strip for the tools you use most.
- A magnet that snaps your points to the open, high, low or close of a candle.
- Ctrl + drag to duplicate any drawing, with all its styles.
- A quick styling bar on every selected object, a settings window built for each object, templates, and an Object List.
- Drawings that stay where you put them when you change the timeframe, switch symbols, or restart MetaTrader.
Built on time and price, not on pixels
Every RhinoDraw object is stored as time and price, never as screen pixels. When you zoom, scroll or change the timeframe, your lines stay on exactly the same bars and prices. Objects are also moved in bars, not in seconds, so a box dragged across a weekend keeps its width. It does not stretch into the gap where the market was closed.
The drawings also look better than standard MetaTrader objects:
- Smooth, anti-aliased lines. Diagonals have no "stairs", and curves are real curves.
- Real transparency. Shade a zone and still see every candle under it.
- Dashed and dotted lines stay correct at any zoom. The pattern never stretches.
- Its own drawing layer. Your existing MetaTrader objects are never touched.
- One redraw for the whole chart, so a hundred drawings cost the same as one and the chart stays responsive.
Quick start: your first trend line in ten seconds
- Attach RhinoDraw to any chart. The toolbar appears on the left.
- Click a tool in the toolbar. Its button lights up and a small cross follows the mouse, showing that the next click starts a new object.
- Click on the chart to place each point. A trend line needs two clicks.
- The object is finished when its last point is placed. The tool stays in your hand, so you can draw the next one straight away.
- Press Esc or click the right mouse button to put the tool down.
You can also draw any two-point object in one movement: press the left button, drag and release. Both ways work everywhere.
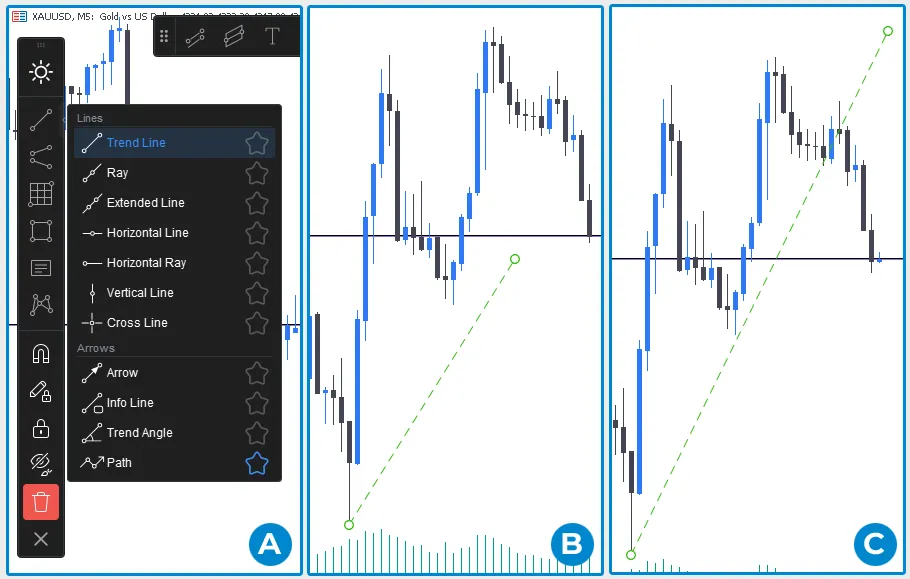
Figure 2. Drawing a trend line: arm the tool, click, click.
The toolbar and tool groups
The toolbar has three parts: a grip at the top to move it anywhere on the chart, nine tool group buttons in the middle, and the action buttons at the bottom.
- Each group button shows the tool you used last from that group, so the toolbar slowly adapts to the way you work.
- Click the button to arm the tool it shows.
- Hover the button and click the small arrow that appears, or right-click the button, to open the whole group.
- Picking a tool from the list arms it and makes it the new face of that group.
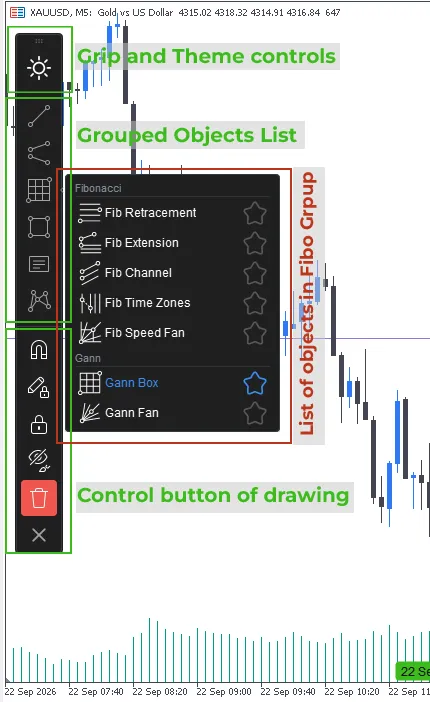
Figure 3. The toolbar, with the Fibonacci group open.
Favourites: your own short toolbar
Most traders use four or five tools all day. Open any group and click the star beside a tool, and it joins the favourites strip, a small bar where one click arms the tool. The strip has its own grip, so you can put it wherever your eyes already are. Your favourites are saved and are still there tomorrow.

Figure 4. The favourites strip with starred tools.
The magnet: snap to OHLC like on TradingView
The magnet button in the toolbar makes your points stick to the candles. With the magnet on, every point you place snaps to the nearest open, high, low or close, so a support line starts exactly on the wick and a zone ends exactly on a candle body.
- Time snaps to the candle under the mouse. The point never jumps to a neighbouring bar.
- Price snaps to the nearest OHLC across the whole span you are drawing. This is what makes order blocks and FVGs easy. Draw a rectangle from an old candle out to the right, and its edge still snaps to the high of the candle you started from, even though the mouse is far away from it.
- It only pulls when you are close. If no price is near the mouse, the point goes exactly where you click, as if the magnet were off. You never have to fight it.
- A small ring shows the point it snapped to, so you always know why a point moved.
- Hold Ctrl to flip the magnet for one point: with the magnet off, Ctrl snaps; with the magnet on, Ctrl places the point freely.
- The magnet also works when you drag a handle of an existing object. Brush and Highlighter are never snapped, because a freehand stroke must stay freehand.
- The magnet setting is remembered between sessions.
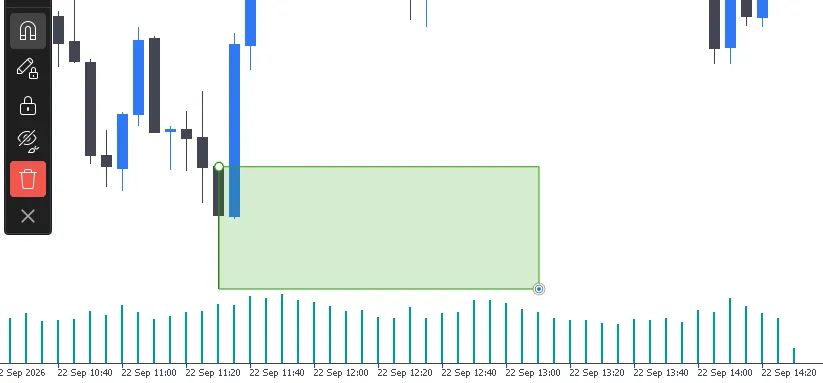
Figure 5. The magnet snapping a rectangle edge to a candle high.
Select, move, reshape and duplicate
- Click an object to select it. Square handles appear on its points and the quick styling bar appears near it.
- Drag a handle to move one point and reshape the object.
- Drag the body to move the whole object.
- Hold Shift while drawing or dragging to lock the movement to one axis. A trend line drawn with Shift is perfectly flat, both in the preview and where you click.
- Hold Ctrl and drag the body to duplicate the object. The original stays where it was, and an exact copy (same colours, levels, captions and settings) lands where you release the mouse. Press Esc during the drag and no copy is made.
- Delete removes the selected object. You can also delete from the right-click menu, the quick styling bar or the Object List.
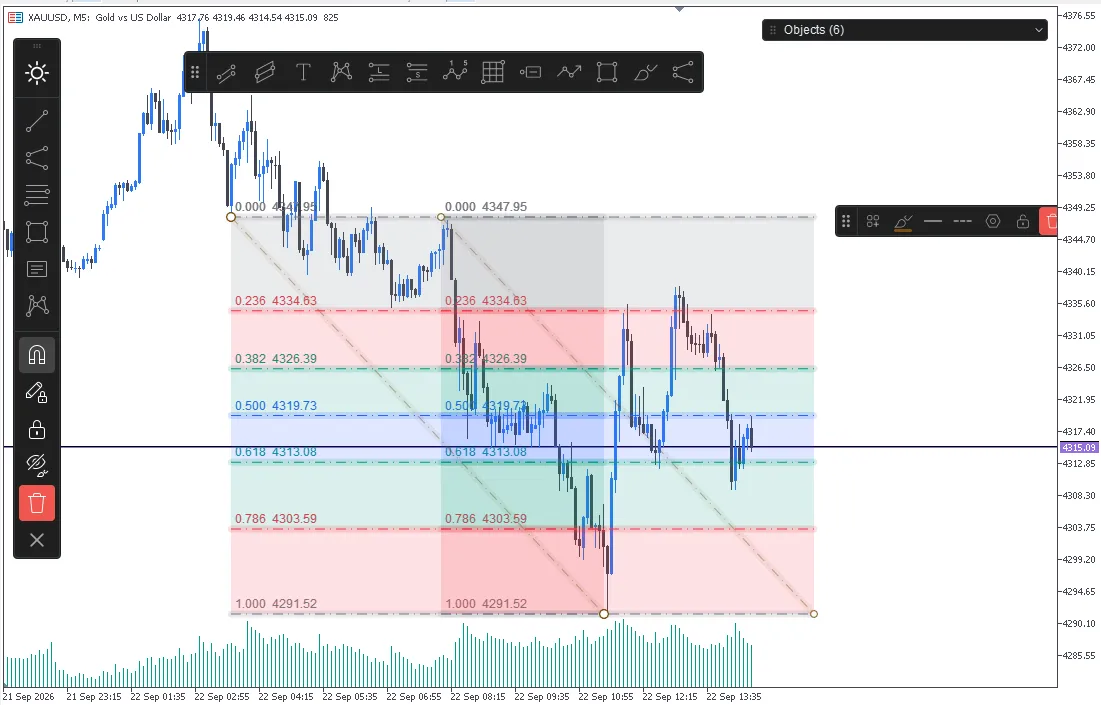
Figure 6. Ctrl + drag makes an exact copy of any drawing.
The right mouse button is always predictable
- While drawing, the right button means cancel. The half-drawn object disappears and the tool is put down. MetaTrader's own menu does not pop up in the middle of your work.
- On an object, the right button opens RhinoDraw's menu for that object: templates, lock, hide, settings, delete.
- On an empty chart, you get MetaTrader's normal menu, as always.
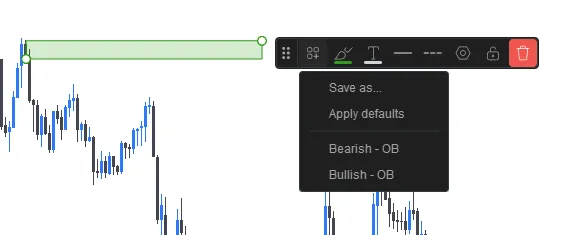
Figure 7. The right-click menu on an object.
Text on (almost) every object
A trend line, a rectangle, a channel or an ellipse can all carry a caption, not only the Text and Note tools. Double-click an object to start typing, press Enter to finish, and Shift + Enter for a new line. On a sloping line the caption follows the angle of the line. In the Text tab of the settings you choose the size, weight, colour and a 3×3 position: above, below, at the start, in the middle, and so on.
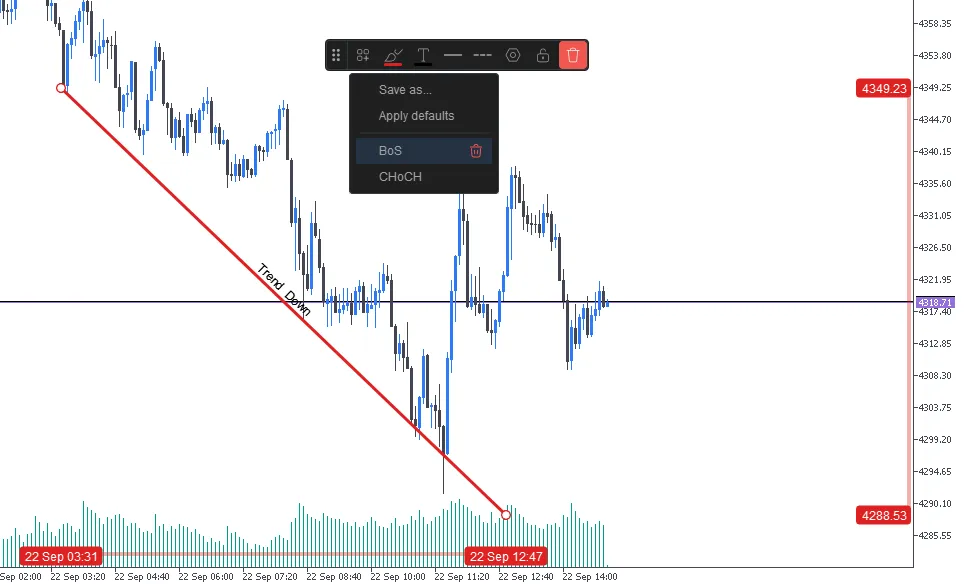
Figure 8. A caption follows the angle of its line.
The quick styling bar
Select an object and a small bar appears near it with the things you change most: line colour, text colour, width, line style, templates, settings, lock and delete. Every change is applied at once. The bar only shows the buttons that make sense for that object: a Flag has no line width, and a Price Label has no line style, so those buttons are not there. It has its own grip if it ever lands in your way.
Figure 9. The quick styling bar with the colour picker open.
The settings window: live and safe
Open it from the gear on the styling bar, from the right-click menu, from the Object List, or by pressing S with an object selected. The window is built for each object, so a Gann Box shows Gann settings and a text note shows text settings. It has four kinds of tab:
- Style: colours, width, line type, fills, arrows and extensions, and the levels of Fibonacci and Gann tools.
- Text: the caption, font size, bold, colour, alignment and the 3×3 position grid.
- Coordinates: every point as time and price, so you can type an exact level instead of nudging it with the mouse.
- Visibility: which timeframes the object appears on, and whether its range is shown on the axes.
Every change is live: pick a colour and the object changes on the real chart, against the real candles. Cancel puts everything back exactly as it was. OK keeps it and remembers it as your new default for that tool.
Level-based tools use a compact grid. Each level is one small cell of [on/off] [value] [colour], laid out two per row, so even a Gann Box with 14 levels fits in one tidy tab. Backgrounds are set with an on/off switch and an opacity slider, just like the transparency slider of the colour picker.
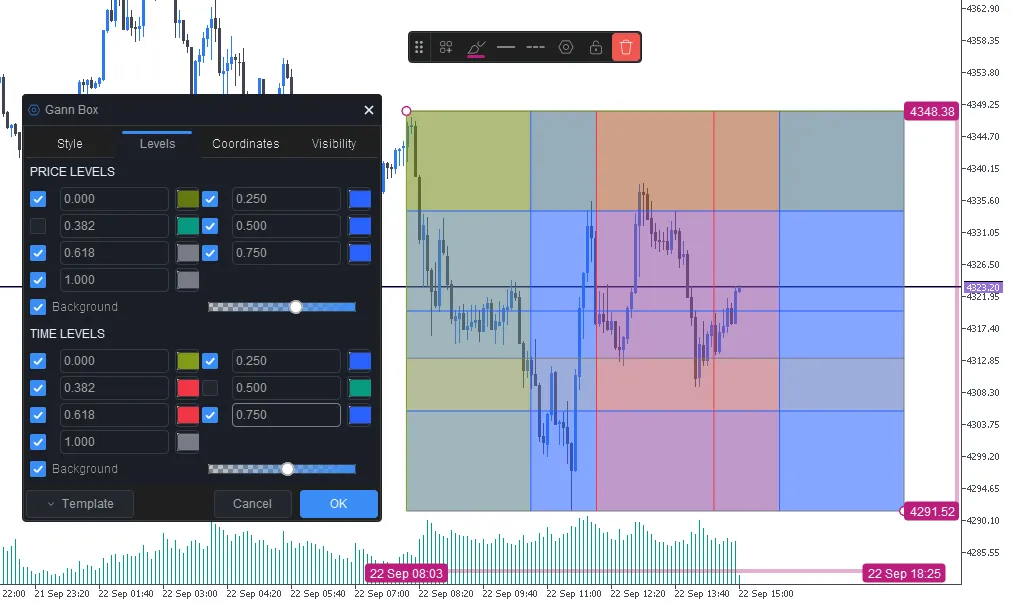
Figure 10. The settings window with compact level cells and background sliders.
Templates: save a look, reuse it anywhere
A template is a style saved under a name, for example "Bullish OB", "Bearish FVG" or "BoS". Templates are available in three places: the Template button of the styling bar, the Template entry of the right-click menu, and the Template button of the settings window.
- Save as… asks for a name and saves the current look.
- Apply defaults returns the object to your last-used style for that tool.
- Click a saved name to apply it.
- Hover a saved name and click the trash icon to delete it. The list updates in place and stays open, so you can tidy several at once.
A template carries the whole look: colours, widths, fills and opacity, the caption, and for Fibonacci and Gann tools every level with its on/off state, value and colour. It never carries the position, so applying a template never moves your drawing. Templates are saved on your computer and survive a restart.
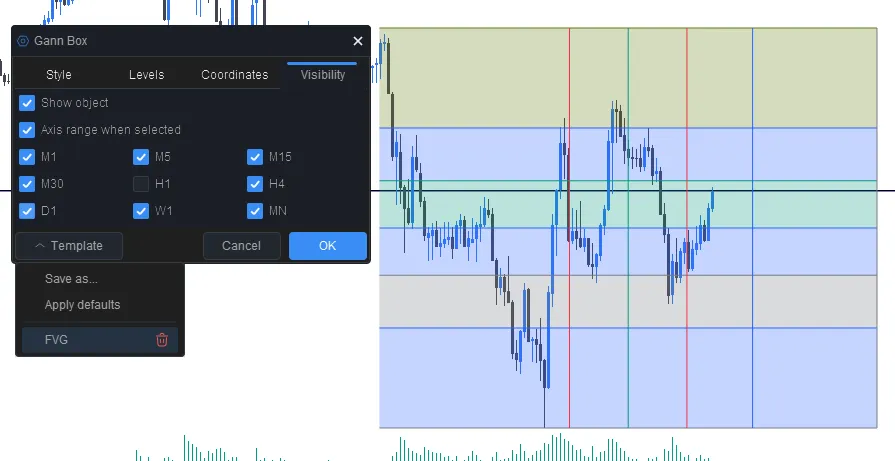
Figure 11. Templates, with the trash icon to delete one.
The Object List: everything you drew, in one place
A small bar reading Objects (N) opens the list of every drawing on the chart. Click the bar to open it and click it again to close it. It stays open while you work, even when you press toolbar buttons such as Lock All, so you can watch the result. Each row has four buttons: eye (hide or show), lock, gear (settings) and trash. A locked or hidden object shows its icon lit, so you can see its state at a glance. Clicking a row selects the object, and a hidden object stays in the list, so you can always bring it back.
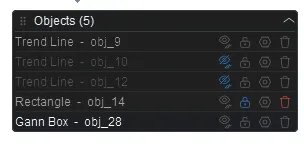
Figure 12. The Object List with locked and hidden objects.
Timeframes, symbols and saving your work
- Your drawings are saved with the chart. Change the timeframe, switch the symbol and come back, or close and reopen MetaTrader: everything is still there, with all its settings.
- The Visibility tab has one checkbox per timeframe. Show a weekly level on H4 and D1 only, and keep your M1 chart clean.
- An object belongs to the symbol it was drawn on. On another symbol it is not shown and not clickable, but it is not deleted.
- Note: removing RhinoDraw from the chart removes its drawings too. To keep them, leave the tool on the chart and use Hide All for a clean view.
Lock Drawing, Lock All, Hide All, Delete All
- Lock Drawing: no new object can be started. Use it when your analysis is done and you only want to click around.
- Lock All: the objects that already exist cannot be moved or selected. New objects you draw while it is on are locked too.
- Hide All: a clean chart for a moment. Press again to bring everything back.
- Delete All: removes every drawing. This cannot be undone, which is why it is the one red button.
Light and dark, and MetaTrader 4
One button switches the whole interface between light and dark. That covers the toolbar, favourites, styling bar, settings window, Object List and menus, so RhinoDraw fits a white chart as well as a black one. The colours of your drawings are never changed. RhinoDraw is available for both MetaTrader 5 and MetaTrader 4 with the same tools and the same interface.
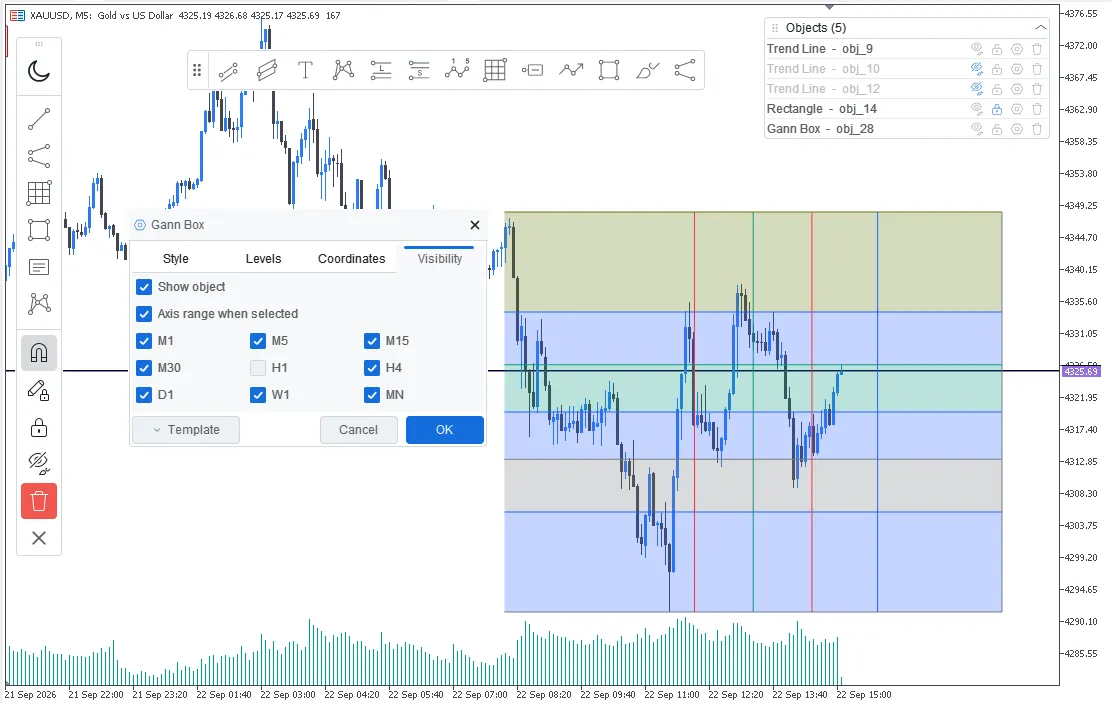
Figure 13. The interface in light mode.
Keyboard and mouse cheat sheet
- Esc: cancel the object you are drawing and put the tool down. Otherwise, clear the selection. While typing a caption, stop editing.
- Delete: while drawing, cancel. With an object selected, delete it.
- Enter: finish a Path or Polyline. While typing, finish the caption (Shift + Enter for a new line).
- S: open the settings of the selected object.
- Shift (held): lock drawing or dragging to one axis.
- Ctrl (held while placing a point or dragging a handle): flip the magnet for that point.
- Ctrl + drag an object's body: duplicate it.
- Double-click an object: type its caption. Double-click also finishes a Path or Polyline.
- Right button: while drawing, cancel. On an object, its menu. On an empty chart, MetaTrader's menu.
Questions
I hid an object and cannot find it. Open the Object List and click the eye on its row. Hidden objects are never deleted.
I cannot move my object. It is probably locked. Check the lock icon in the Object List, or whether Lock All is on.
I click on the chart and nothing is drawn. Lock Drawing is probably on. Turn it off in the toolbar.
My point jumps when I place it. That is the magnet. Hold Ctrl to place that one point freely, or turn the magnet off in the toolbar.
Will my drawings be there tomorrow? Yes. Drawings are saved with the chart and come back after a timeframe change, a symbol change or a restart of MetaTrader, as long as RhinoDraw stays attached to the chart.
Next: in the second post we go through every drawing object (lines, channels, Fibonacci, Gann, shapes, annotations, patterns and projection tools) and how to draw each one.
Questions, ideas or custom work? Send me a message on MQL5 or Telegram. If RhinoDraw helps your trading, a review helps me a lot.
Originally published on my MQL5.com blog.